
一、民营企业排行全景图
1. 研究方法
民企是市场经济的基石,我国民企法人数占比达98%。2012年至2020年,全国企业法人中,国有企业法人占比从3.36%下降至1.17%,民营企业法人占比从96%上升至98%,外资企业法人占比从2.54%下降至0.41%。2021年,全国市场主体共1.5亿户,其中,企业法人单位数2600多万家,个体工商户1亿多个。
从宏观来看,民营企业贡献了50%以上的税收,60%以上的国内生产总值,70%以上的技术创新成果,80%以上的城镇劳动就业,90%以上的企业数量。
当前对民营企业排名的研究主要从营业收入和估值两个指标入手。
营收排行法是借助调研获取民营企业数据,以营业总收入作为排行依据。代表成果有工商联、中企协、《财富》发布的年度500强榜单。这种方法自下而上由企业自行申报,颗粒度高,但会遗漏未参与调研的企业,部分企业申报数据难以获得交叉验证。
估值排行法是按照企业市值或估值进行排名。代表成果有胡润研究院发布的《2021胡润中国500强》,上市公司市值按照年末收盘价计算,非上市公司估值参考同行业上市公司或根据最新一轮融资情况进行估算。这种方法更加客观,但对传统行业非上市公司覆盖不全。
本文营业收入作为民营企业排行的主要依据,力求全面、客观、完整。我们对比工商联、中企协、《财富》、胡润等榜单,并结合Wind在中国及海外上市、发债中国民营企业,统计民营企业2021年营业收入。在统计营收数据时,优先采用上市公司或发债企业的公开披露年报数据,此种情形有45家;若无公开披露年报数据,优先采用工商联披露的数据,此种情形有48家;有7家民企的财报口径与工商联披露数据不一致,我们猜测存在纳税口径和财务口径的差异,为保证企业营收对比的一致性,此类情形统一采用工商联披露数据。 数字化转型网(www.szhzxw.cn)
在时点选择上,本文采用2021年营业收入作为民营企业排行的主要依据。截至2023年3月24日,仅有20家民企公布了2022财年的营收。为保证排名的全面、客观、完整,我们选择2021财年营收作为本次排名依据。部分民企既非上市公司也非发债主体,目前尚无法从公开渠道获取2022财年年报。需等相关企业进行营收自主申报后,将营收数据更新至2022财年。
| 图表:民营企业100强排名 | ||||
| 序号 | 企业名称 | 营 收 ( 亿 元 ) | 省份 | 所属行业 |
| 1 | 京东集团股份有限公司 | 9.515.92 | 北京市 | 互联网和相关服务 |
| 2 | 阿里巴巴(中国)有限公司 | 8,530.62 | 浙江省 | 互联网和相关服务 |
| 3 | 恒力集团有限公司 | 7,323.45 | 江苏省 | 化学原料和化学制品制造业 |
| 4 | 华为投资控股有限公司 | 6.306.98 | 广东省 | 计算机、通信和其他电子设备制造业 |
| 5 | 腾讯控股有限公司 | 5.601.18 | 广东省 | 互联网和相关服务 |
| 6 | 碧桂园控股有限公司 | 5,230.64 | 广东省 | 房地产业 |
| 7 | 联想集团有限公司 | 4,546.47 | 北京市 | 计算机、通信和其他电子设备制造业 |
| 8 | 浙江荣盛控股集团有限公司 | 4,483.18 | 浙江省 | 化学原料和化学制品制造业 |
| 9 | 北京字节跳动科技有限公司 | 4,391.60 | 北京市 | 互联网和相关服务 |
| 10 | 山东魏桥创业集团有限公司 | 4,111.35 | 山东省 | 有色金属冶炼及压延加工 |
| 11 | 浙江吉利控股集团有限公司 | 3,603.16 | 浙江省 | 汽车制造业 |
| 12 | 青山控股集团有限公司 | 3,520.18 | 浙江省 | 黑色金属冶炼及压延加工 |
| 13 | 盛虹控股集团有限公司 | 3,479.79 | 江苏省 | 化学原料和化学制品制造业 |
| 14 | 美的集团股份有限公司 | 3,433.61 | 广东省 | 电气机械和器材制造业 |
| 15 | 浙江恒逸集团有限公司 | 3,288.00 | 浙江省 | 化学原料和化学制品制造业 |
| 16 | 小米通讯技术有限公司 | 3,286.15 | 北京市 | 计算机、通信和其他电子设备制造业 |
| 17 | 江苏沙钢集团有限公司 | 3,036.31 | 江苏省 | 黑色金属冶炼及压延加工 |
| 18 | 泰康保险集团股份有限公司 | 2,619.33 | 北京市 | 保险业 |
| 19 | 中南控股集团有限公司 | 2,602.58 | 江苏省 | 房地产业 |
| 20 | 新希望控股集团有限公司 | 2,526.52 | 四川省 | 农业 |
| 21 | TCL科技集团股份有限公司 | 2.523.50 | 广东省 | 计算机、通信和其他电子设备制造业 |
| 22 | 北京建龙重工集团有限公司 | 2,474.12 | 北京市 | 黑色金属冶炼及压延加工 |
| 23 | 敬业集团有限公司 | 2,379.01 | 河北省 | 黑色金属冶炼及压延加工 |
| 24 | 龙湖集团控股有限公司 | 2,239.19 | 重庆市 | 房地产业 |
| 25 | 比亚迪股份有限公司 | 2,161.42 | 广东省 | 汽车制造业 |
| 26 | 顺丰控股股份有限公司 | 2,071.87 | 广东省 | 邮政业 |
| 27 | 新疆广汇实业投资(集团)有限责任公司 | 2,032.23 | 新疆 | 零售业 |
| 28 | 海亮集团有限公司 | 2,002.74 | 浙江省 | 有色金属冶炼及压延加工 |
| 29 | 德龙钢铁有限公司 | 1,957.22 | 河北省 | 黑色金属冶炼及压延加工 |
| 30 | 河北新华联合冶金控股集团有限公司 | 1.903.93 | 河北省 | 黑色金属冶炼及压延加工 |
| 31 | 中天钢铁集团有限公司 | 1,903.82 | 江苏省 | 黑色金属冶炼及压延加工 |
| 32 | 蚂蚁科技集团股份有限公司 | 1.887.21 | 浙江省 | 互联网和相关服务 |
| 33 | 河北津西钢铁集团股份有限公司 | 1,872.53 | 河北省 | 黑色金属冶炼及压延加工 |
| 34 | 东方希望集团有限公司 | 1,845.21 | 上海市 | 有色金属冶炼及压延加工 |
| 35 | 天能控股集团有限公司 | 1,792.52 | 浙江省 | 电气机械和器材制造业 |
| 36 | 北京三快科技有限公司(美团) | 1.791.28 | 北京市 | 互联网和相关服务 |
| 37 | 中升集团控股有限公司 | 1,787.16 | 中国香港 | 零售业 |
| 38 | 万洲国际有限公司(原双汇集团) | 1,759.74 | 中国香港 | 农副食品加工业 |
| 39 | 洛阳栾川钼业集团股份有限公司 | 1,738.63 | 河南省 | 有色金属矿采选业 |
| 40 | 滴滴全球有限公司 | 1.738.27 | 北京市 | 应用软件 |
| 41 | 新城控股集团股份有限公司 | 1.696.77 | 上海市 | 房地产业 |
| 42 | 复星国际有限公司 | 1,630.22 | 上海市 | 综合 |
| 43 | 万向集团公司 | 1,628.44 | 浙江省 | 汽车制造业 |
| 44 | 新奥集团股份有限公司 | 1,606.00 | 河北省 | 燃气生产和供应业 |
| 45 | 西安迈科金属国际集团有限公司 | 1,598.78 | 陕西省 | 批发业 |
| 46 | 立讯精密工业股份有限公司 | 1,539.46 | 广东省 | 计算机、通信和其他电子设备制造业 |
| 47 | 雅戈尔集团股份有限公司 | 1,439.38 | 浙江省 | 纺织服装、服饰业 |
| 48 | 三一集团有限公司 | 1.402.75 | 湖南省 | 专用设备制造业 |
| 49 | 苏宁易购集团股份有限公司 | 1,389.04 | 江苏省 | 零售业 |
| 50 | 上海均和集团有限公司 | 1,369.57 | 上海市 | 综合 |
| 51 | 长城汽车股份有限公司 | 1.364.05 | 河北省 | 汽车制造业 |
| 52 | 江苏德龙镍业有限公司 | 1,353.82 | 江苏省 | 黑色金属冶炼及压延加工 |
| 53 | 辽宁方大集团实业有限公司 | 1,337.03 | 辽宁省 | 黑色金属冶炼及压延加工 |
| 54 | 东岭集团股份有限公司 | 1,327.66 | 陕西省 | 批发业 |
| 55 | 中天控股集团有限公司 | 1,312.14 | 浙江省 | 房屋建筑业 |
| 56 | 宁德时代新能源科技股份有限公司 | 1,303.56 | 福建省 | 电气机械和器材制造业 |
| 57 | 协鑫集团有限公司 | 1,300.05 | 江苏省 | 电气机械和器材制造业 |
| 58 | 山东东明石化集团有限公司 | 1,286.12 | 山东省 | 石油、煤炭及其他燃料加工业 |
| 59 | 卓尔控股有限公司 | 1,280.38 | 湖北省 | 综合 |
| 60 | 百度集团股份有限公司 | 1,244.93 | 北京市 | 互联网和相关服务 |
| 61 | 宁波金田投资控股有限公司 | 1,228.57 | 浙江省 | 有色金属冶炼及压延加工 |
| 62 | 九州通医药集团股份有限公司 | 1.224.07 | 湖北省 | 批发业 |
| 63 | 神州数码集团股份有限公司 | 1,223.85 | 广东省 | 批发业 |
| 64 | 江苏永钢集团有限公司 | 1,205.61 | 江苏省 | 黑色金属冶炼及压延加工 |
| 65 | 阳光保险集团股份有限公司 | 1,200.68 | 广东省 | 保险业 |
| 66 | 唯品会(中国)有限公司 | 1,170.60 | 广东省 | 零售业 |
| 67 | 海澜集团有限公司 | 1,168.50 | 江苏省 | 纺织服装、服饰业 |
| 68 | 内蒙古伊利实业集团股份有限公司 | 1,105.95 | 内蒙古 | 食品制造业 |
| 69 | 中基宁波集团股份有限公司 | 1.095.44 | 浙江省 | 批发业 |
| 70 | 蓝思科技集团 | 1,093.15 | 湖南省 | 计算机、通信和其他电子设备制造业 |
| 71 | 通威集团有限公司 | 1,082.72 | 四川省 | 综合 |
| 72 | 利华益集团股份有限公司 | 1,080.67 | 山东省 | 石油、煤炭及其他燃料加工业 |
| 73 | 江苏新长江实业集团有限公司 | 1.070.02 | 江苏省 | 黑色金属冶炼及压延加工 |
| 74 | 东方集团有限公司 | 1,055.92 | 黑龙江省 | 综合 |
| 75 | 广东鼎龙实业集团有限公司 | 1,025.84 | 广东省 | 商务服务业 |
| 76 | 福建大东海实业集团有限公司 | 1,012.34 | 福建省 | 黑色金属冶炼及压延加工 |
| 77 | 河北普阳钢铁有限公司 | 1,004.53 | 河北省 | 黑色金属冶炼及压延加工 |
| 78 | 旭辉控股(集团)有限公司 | 975.09 | 上海市 | 房地产业 |
| 79 | 振烨国际产业控股集团(深圳)有限公司 | 960.19 | 广东省 | 综合 |
| 80 | 深圳市爱施德股份有限公司 | 951.66 | 广东省 | 批发业 |
| 81 | 上海寻梦信息技术有限公司(拼多多) | 939.50 | 上海市 | 互联网和相关服务 |
| 82 | 天津荣程祥泰投资控股集团有限公司 | 923.19 | 天津市 | 黑色金属冶炼及压延加工 |
| 83 | 永辉超市股份有限公司 | 910.62 | 福建省 | 零售业 |
| 84 | 弘阳集团有限公司 | 880.01 | 江苏省 | 综合 |
| 85 | 网易(杭州)网络有限公司 | 876.06 | 浙江省 | 互联网和相关服务 |
| 86 | 山西鹏飞集团有限公司 | 861.97 | 山西省 | 石油、煤炭及其他燃料加工业 |
| 87 | 双胞胎(集团)股份有限公司 | 860.65 | 江西省 | 农副产品加工业 |
| 88 | 广东海大集团股份有限公司 | 859.99 | 广东省 | 农副产品加工业 |
| 89 | 永锋集团有限公司 | 851.25 | 山东省 | 黑色金属冶炼及压延加工 |
| 90 | 华勤技术股份有限公司 | 837.59 | 上海市 | 计算机、通信和其他电子设备制造业 |
| 91 | 牧原实业集团有限公司 | 832.76 | 河南省 | 畜牧业 |
| 92 | 北京快手科技有限公司 | 811.17 | 北京市 | 互联网和相关服务 |
| 93 | 隆基绿能科技股份有限公司 | 809.32 | 陕西省 | 电气机械和器材制造业 |
| 94 | 贝壳控股有限公司 | 807.52 | 北京市 | 互联网和相关服务 |
| 95 | 杭州锦江集团有限公司 | 805.64 | 浙江省 | 有色金属冶炼及压延加工 |
| 96 | 恒信汽车集团股份有限公司 | 802.14 | 湖北省 | 零售业 |
| 97 | 武安市裕华钢铁有限公司 | 800.80 | 河北省 | 黑色金属冶炼及压延加工 |
| 98 | 瑞钢联集团有限公司 | 797.78 | 北京市 | 批发业 |
| 99 | 浙江富冶集团有限公司 | 793.71 | 浙江省 | 有色金属冶炼及压延加工 |
| 100 | 研祥高科技控股集团有限公司 | 791.42 | 广东省 | 计算机、通信和其他电子设备制造业 |
| 资料来源:工商联、中企协、《财富》 Wind、泽平宏观整理注:5家企业未包含在工商联榜,分别为北京字节跳动科技有限公司、敬业集团、万洲国际有限公司(原双汇集团)、滴滴全球有限公司、北京快手科技有限公司。字节跳动的营收数据来自《华尔街日报》。 | ||||
2. 百强民企画像:头部亮眼,东部聚集,五成为制造业
2021年民营企业百强的营收门槛为791.4亿元,五成百强企业的营收处于1000-2000亿元区间。2012年至2021年,规模以上工业企业营业收入中民营企业占比从49.7%提升至51.8%。民企30强、50强、百强营收门槛分别为1903.9亿元、1369.5亿元和791.4亿元。49家的百强企业营收在1000-2000亿区间,营收平均为1417.1亿元,千亿级民营企业正在成为中坚力量。
前十强民营企业入围门槛约为4100亿元,以互联网、先进制造为代表。其中以京东、阿里巴巴、腾讯、字节跳动为代表的互联网企业占据4席,京东商业模式以自营为主,其销售额大部分计为收入,以9515.9亿元的营收位居第一,2022年营收破万亿。以恒力集团、荣盛为代表的化学原料和化学制品制造业占据2席。以华为、联想为代表的计算机、通信、电子设备先进制造业占据2席,以碧桂园为代表的房企占据1席,以山东魏桥为代表的有色金属冶炼及压延加工业占据1席。
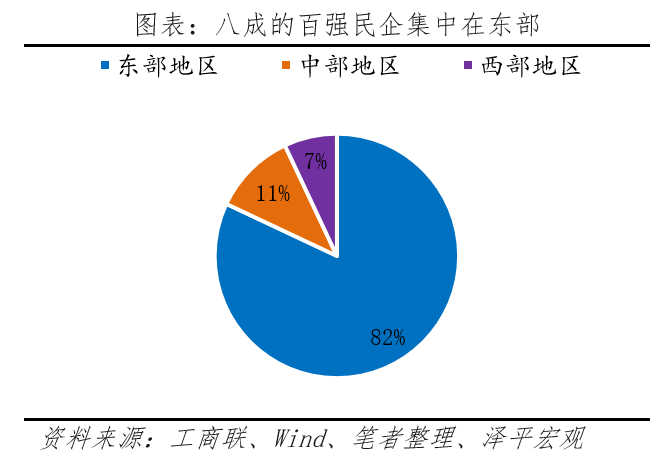
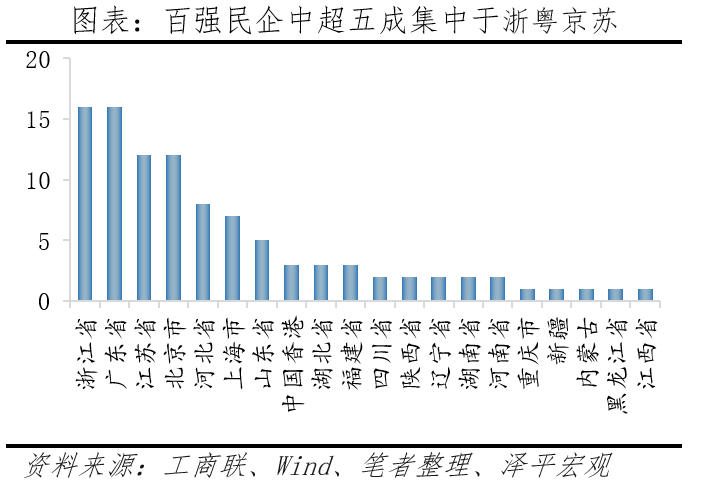
地域方面,八成的百强民企集中在东部。分地区来看,2021年百强民企中有82家分布于东部地区,长三角、京津冀和珠三角的分布数量分布为35家、22家和16家。分省份来看,55%的企业集中于粤浙京苏,广东省、浙江省、北京市、江苏省的百强民企数量分别为16家、16家、12家、12家。分城市来看,百强民企主要集中于北上广深和新一线城市。都市圈、城市群发挥着国家经济社会发展的增长极作用,是推进高质量发展和参与国际竞争的主要平台。头部民企集中在都市圈城市群,契合了中国人口和产业持续向大都市圈集聚的大趋势。
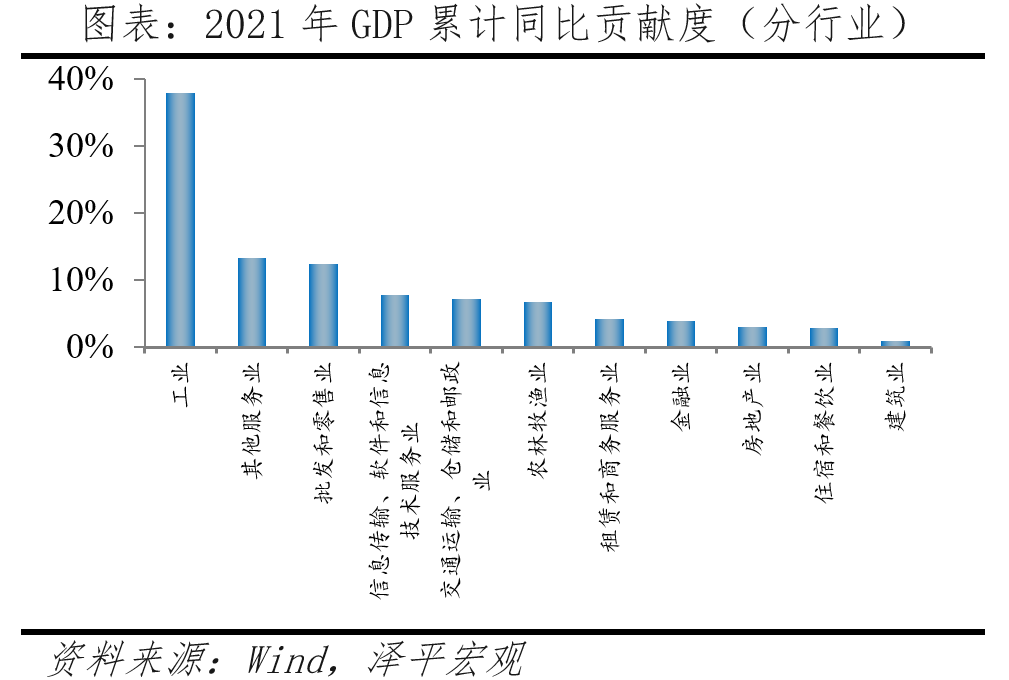
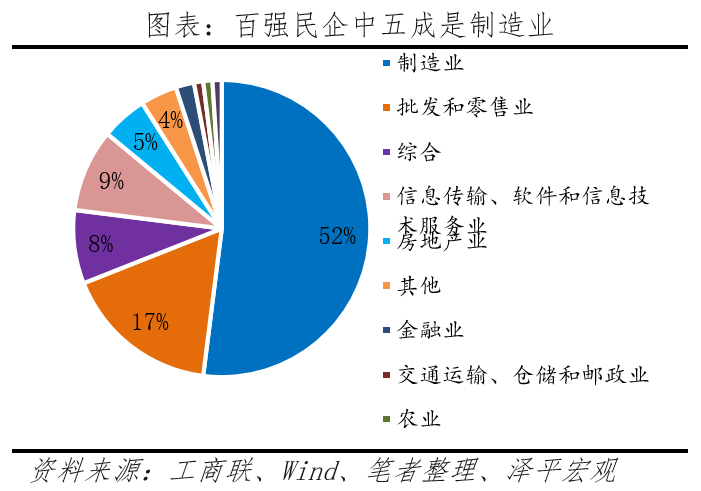
行业分布上,制造业在百强中占比超五成。对GDP贡献度较高的行业容易出龙头民企,传统行业对GDP贡献度更高。分行业来看,2021年工业对GDP累计同比贡献度达到38%,在2021年百强民企中制造业企业占比达到52%,远超其他行业。批发和零售业,信息传输、软件和信息技术服务业对GDP贡献度分别为12.3%和7.8%,相关行业分别有17家和9家企业进入百强榜。
资本市场化进程卓有成效。2021年有38家百强民企为上市公司,平均募资金额为133亿元。16家民企的旗下有上市板块。59家企业或下属公司为发债主体,通过企业债融资助力民企信心修复。在全面注册制的改革春风下,以民营经济为代表的优质企业融资门槛降低,提振民营企业家信心,未来将有越来越多的优秀企业壮大资本市场。
完全隔离于资本市场的民企有20家。百强民企榜单中有20家无上市和发债记录,完全隔离于资本市场,其中制造业、批发和零售业分别为9家和3家。
企业盈利能力呈现分化。53家民营企业披露了2021年盈利情况。2021年仅腾讯的销售净利率突破20%,达到40.6%,较去年同期增长7.4个百分点。9家民企的净利率在10%-20%之间,较去年盈利提升/下降的分别有6家和3家,企业盈利能力呈现分化。有数据披露的53家民企中,2021年净利率不足10%的企业达到43家,较2020年增加了4家,表明近两年国内外经济形势在一定程度上影响企业经营,进而影响企业盈利能力。 数字化转型网(www.szhzxw.cn)
3. 纵向变迁:产业结构升级、社会责任提升,转型高质量发展
经济新常态下民企顺应高质量发展要求转型升级。中国经济从高速增长转向高质量发展,民营企业顺势进行转型升级。根据工商联调研,做强做大企业、政策支持引导、产品技术升级换代、国内经济增长趋缓是民企转型的主要动因。从转型方式来看,企业转型维度从人才、企业向产品、技术延伸。2017年企业转型主要通过人才引进、员工培训和战略调整等方式,当前企业更希望通过技术和管理创新、提高产品质量来实现转型升级。根据工商联调研,2020年运用互联网、人工智能、大数据等技术来实现转型升级的企业数量,在500强中的占比达到78.4%。
民企500强产业结构优化调整,房地产降,制造业升。民企500强前十大行业以传统制造业为主,黑色金属冶炼和压延加工业位居榜首,2017-2021期间企业数增加了20家。2021年入围500强的制造业企业较2020年增加19家,同比上涨12%。其中,黑色金属冶炼和压延加工业、电气机械和器材制造业、计算机通信和其他电子设备制造业、石油煤炭及其他燃料加工业、有色金属冶炼及压延加工、化学原料和化学制品制造业分别较上年增长了6家、2家、4家、3家、2家、2家。受人口增长拐点、房企流动性危机、停贷事件冲击,2021年入围500强的房企数量仅有25家,同比下降43%。十四五规划实施以来,新基建逐渐成为高质量发展的重要抓手,新一代信息技术、人工智能、数据中心得到发展,近五年计算机、通信和其他电子设备制造业的企业数量增长了4家。新能源、充电桩、特高压、工业互联网等科技创新领域虽未跻身前十大行业,但已逐渐成为中国经济的新引擎。
政策端发力减税降费、降息来缓解民企缴税、融资、成本难题。原材料成本、缴税负担、融资成本是制约民企经营的三座大山。2020年以来,上游原材料价格持续高位运行,线下物流消费场景受限,民营企业的现金流和利润受到侵蚀。根据工商联调研,2021年营收超1000亿元的企业数较2020年下降了10家。影响民企500强发展的成本因素中,选择“原材料成本”、“缴税负担”和“融资成本”的企业数占500强比例分别为65.4%、51%和48%。为降低企业缴税负担,2018年来我国累计为个体工商户减税降费13855亿元。为降低企业融资成本,央行下调LPR来引导实际贷款利率下行,2022年新发放企业贷款加权平均利率为4.17%,同比下降0.34个百分点。
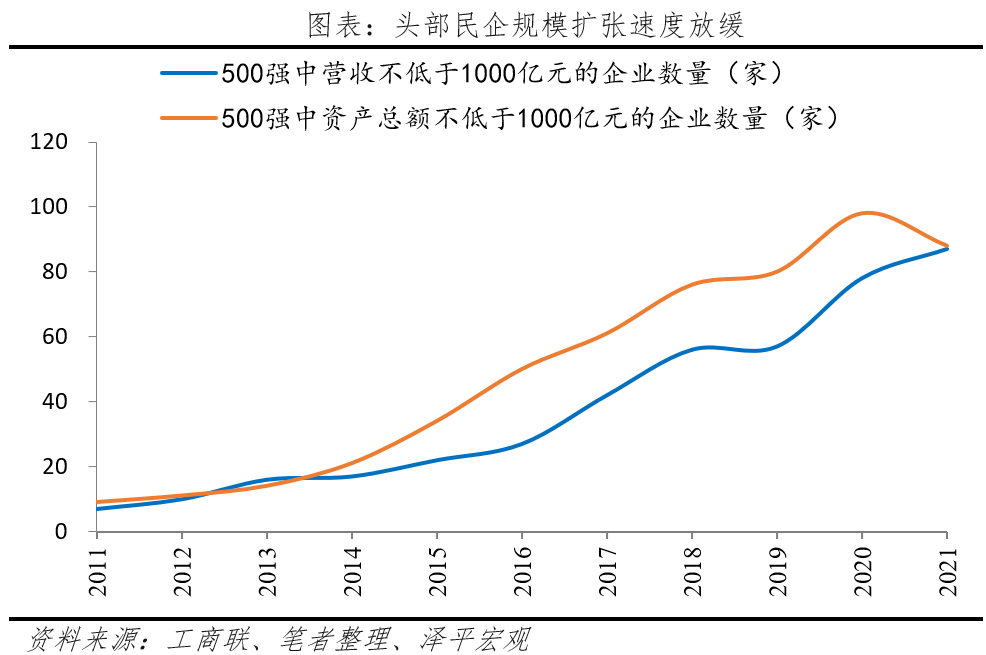
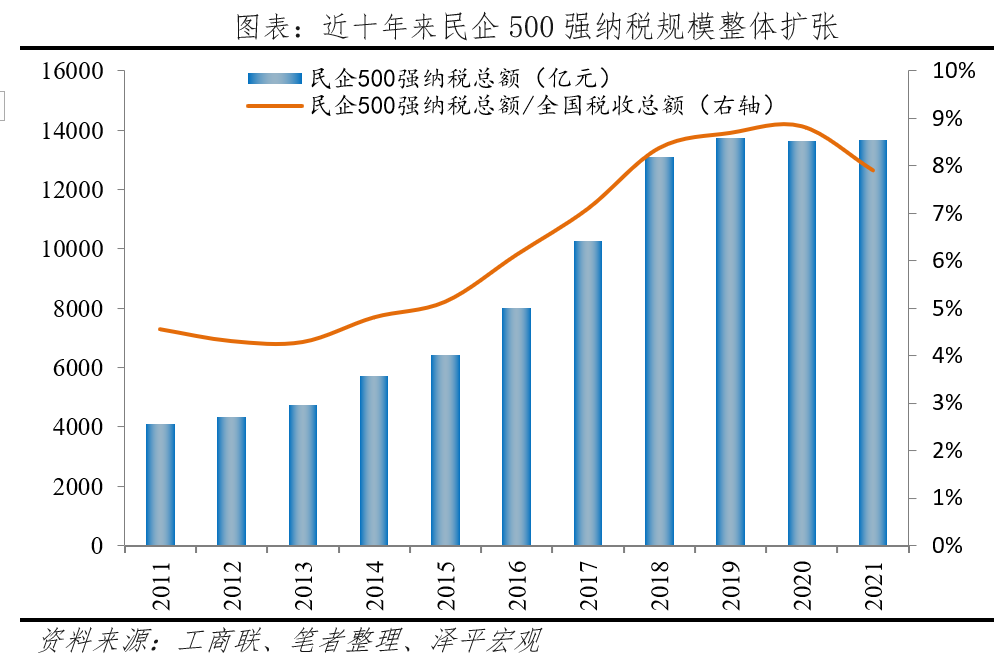
民营企业的社会责任感提升。纳税总额方面,2011-2021年民企500强纳税总额从4094亿元上涨到13665亿元,年化增速达13%,占全国税收比例从4.6%上涨至7.9%。2018-2021年民企500强纳税总额整体稳定在1.3-1.4万亿区间。精准扶贫方面,500强中 参与精准扶贫的企业数量从2017年227家上升为2021年348家,占民企500强比重从45.4%上涨到69.6%。污染防治方面,500强中已参与污染防治攻坚战的企业比例从2017年68.2%上升为2021年85.2%。 数字化转型网(www.szhzxw.cn)
国际化经营能力提升。2021年民企500强出口总额达到2454亿美元,同比增长85.5%。民企500强对全国出口的贡献率从2017年5.5%上涨到2021年7.3%。2021年500强民企的海外投资项目达到2701项,较2017年上涨79.7%。2021年500强企业中有54%对外直接投资,39%通过产品和服务出口的方式实现“走出去”。
二、吸纳就业10强
从就业岗位来看,2012年至2021年,全国城镇就业人员从37287万人增至46773万人,增长25.4%;其中,城镇私人企业就业人员和个体就业人员分别从2012年的7557万人、5643万人增至2019年的14567万人和11692万人,增长分别为92.8%和107.2%。
就业是经济稳定的重要保障,是人民安居乐业的“压舱石”。根据市场监管总局公布,民营企业吸纳了80%以上的城镇劳动就业,是创业就业的主要载体。吸纳就业10强榜单的数据来自Wind,覆盖有数据的上市公司和发债企业,数据非公开、不同统计口径下数据偏差较大的企业未包含在内。
2021年民营企业吸纳就业10强门槛为11.5万人。京东集团吸纳就业数位居第一,员工总数突破30万,达到38.5万人。比亚迪、阿里巴巴集团和立讯精密位列第二、三、四名,就业总数均突破20万人。
行业分布上,3家为计算机、通信和其他电子设备制造业,互联网和相关服务、汽车制造业分别有2家。
| 图表:民营企业吸纳就业10强 | |||||
| 序号 | 企业名称 | 就业人数 | 省份 | 所属行业 | |
| 1 | 京东集团股份有限公司 | 385,357 | 北京市 | 互联网和相关服务 | |
| 2 | 比亚迪股份有限公司 | 288.186 | 广东省 | 汽车制造业 | |
| 3 | 阿里已巴集团控股有限公司 | 251.462 | 浙江省 | 互联网和相关服务 | |
| 4 | 立讯精密工业股份有限公司 | 228,152 | 广东省 | 计算机、通信和其他电子设备制造业 | |
| 5 | 华为投资控股有限公司 | 195,000 | 广东省 | 计算机、通信和其他电子设备制造业 | |
| 6 | 顺丰控股股份有限公司 | 177.129 | 广东省 | 邮政业 | |
| 7 | 美的集团股份有限公司 | 165.799 | 广东省 | 电气机械和器材制造业 | |
| 8 | 蓝思科技股份有限公司 | 156,880 | 湖南省 | 计算机、通信和其他电子设备制造业 | |
| 9 | 永辉超市 | 123.797 | 福建省 | 零售业 | |
| 10 | 浙江吉利控股集团有限公司 | 115,395 | 浙江省 | 汽车制造业 | |
| 资料来源: Wind、笔者整理、泽平宏观 | |||||
三、创新企业10强
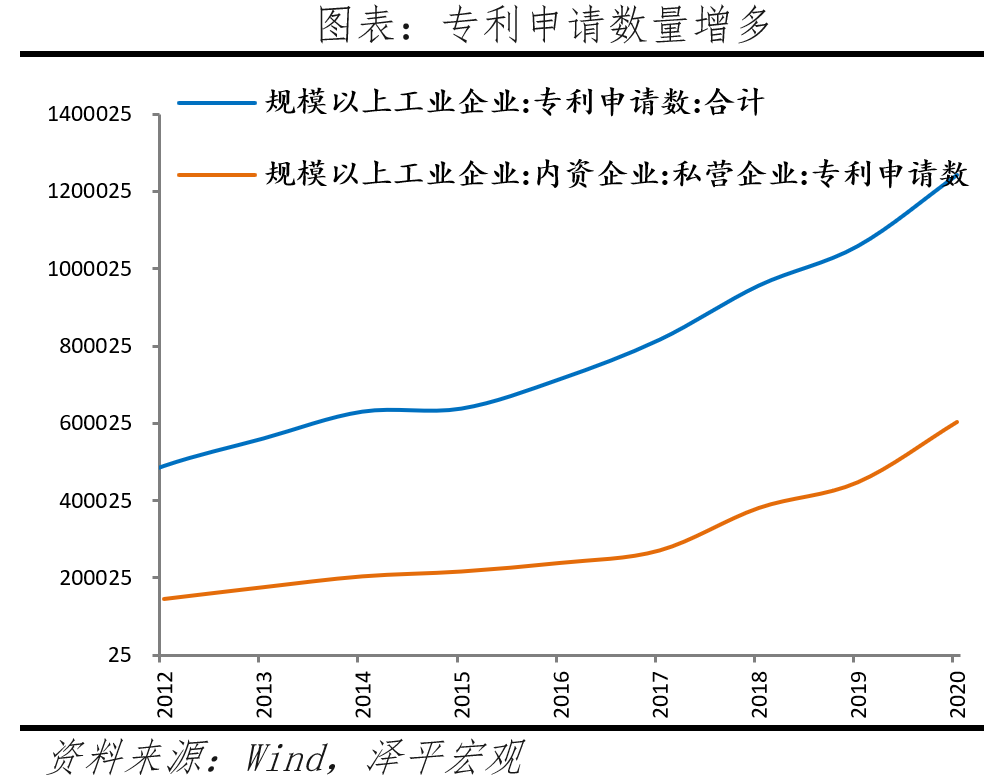
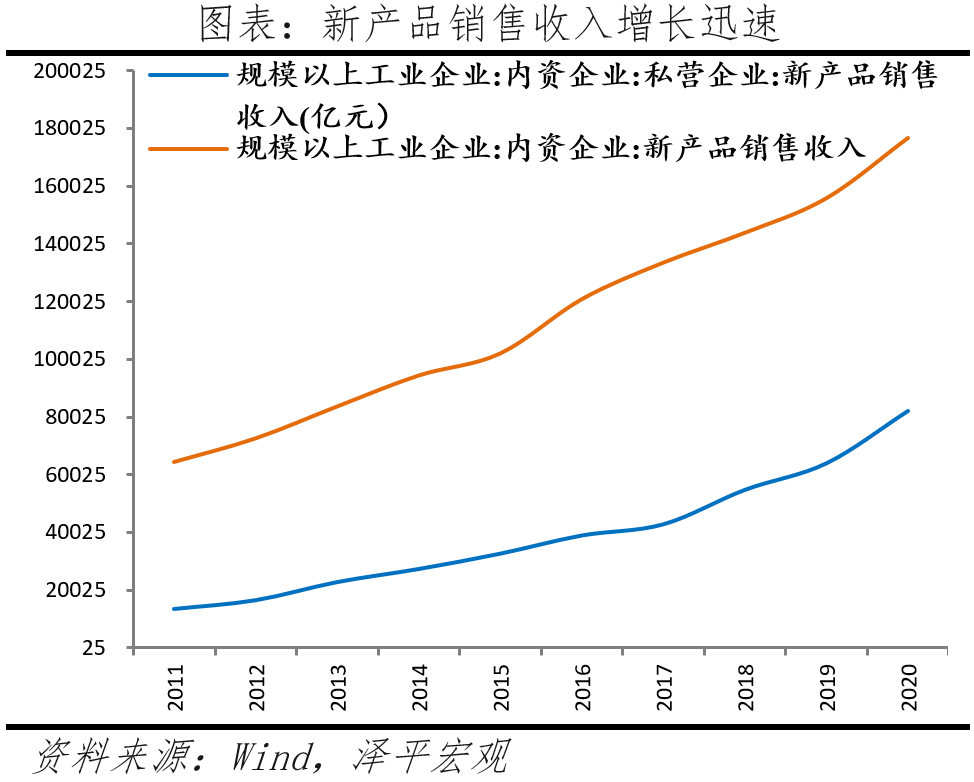
从研发创新看,2012年至2021年,规模以上工业企业申请专利数量从489945件增加至1403611件,增长约3倍。其中,私营企业申请专利的数量占比从2012年的29.4%提升至2021年的51.4%。规模以上工业企业的新产品销售收入从2012年的11052.98亿元提升至2021年的295566.69亿元,民营企业在其中占比从2012年的14.97%提升至2021年的37.92%。
为衡量民营企业创新力,定义研发费用(亿元)、研发费用占营收比重(%)的加权结果。吸纳就业10强榜单的数据来自Wind,覆盖有数据的上市公司和发债企业,数据非公开、不同统计口径下数据偏差较大的企业未包含在内。 数字化转型网(www.szhzxw.cn)
2021年民营企业创新力前五依次为华为、百度、快手、网易和腾讯。研发费用来看,华为、阿里巴巴和腾讯的研发费用超500亿元,分别达到1425.7亿元、572.4亿元和518.8亿元。研发投入强度来看,民企前五强依次为华为、百度、快手、网易和蚂蚁集团,研发费用占营收比重均超过10%。
| 图表:民营企业创新力10强 | ||||
| 序 号 | 企业创新力指数 | 研发费用(亿元,权重50%) | 研发费用占营业收入比重 (%,权重50%) | |
| 1 | 华为投资控股有限公司 | 100.0 | 1,425.7 | 22.6% |
| 2 | 百度集团股份有限公司 | 53.0 | 249.4 | 20.0% |
| 3 | 北京快手科技有限公司 | 46.2 | 150.0 | 18.5 |
| 4 | 网易(杭州)网络有限公司 | 40.5 | 140.8 | 16.1% |
| 5 | 腾讯控股有限公司 | 38.6 | 518.8 | 9.2% |
| 6 | 阿里巴巴集团控股有限公司 | 37.8 | 572.4 | 8.0% |
| 7 | 蚂蚁科技集团股份有限公司 | 28.7 | 188.5 | 10.0% |
| 8 | 北京三快科技有限公司(美团) | 26.5 | 166.8 | 9.3% |
| 9 | 上海寻梦信息技术有限公司 (拼多多) | 24.3 | 89.9 | 9.6% |
| 10 | 浙江吉利控股集团有限公司 | 21.8 | 226.2 | 6.3% |
| 资料来源: Wind、公司年报、笔者整理、泽平宏观 | ||||
四、民企纳税10强
民营企业纳税10强榜单的数据来自Wind-资产负债表-应交税费(应交税金)和现金流量表中支付的各项税费,综合考虑企业已交和未交税费,从而更全面地衡量企业的纳税实力。
统计口径不同于工商联榜单的“纳税额”,因此两榜单的企业排名和数值存在差异。本榜单覆盖有数据的上市公司和发债企业,数据非公开、不同统计口径下数据偏差较大的企业未包含在内。
从纳税行业来看,以融创、碧桂园、龙湖集团、新城控股、时代控股为代表的房地产业占据5席,以华为、联想为代表的计算机、通讯和其他电子设备制造业占据2席。从省份来看,前10强中有五家来自广东省。
| 图表:民营企业纳税10强 | ||||||
| 序号 | 企业名称 | 应交税款 | 支付的各 项税费 | 合计 (亿元) | 省份 | 所属行业 |
| 1 | 融创房地产集团有限公司 | 587.11 | 183.70 | 770.81 | 天津 | 房地产业 |
| 2 | 碧桂园地产集团有限公司 | 383.26 | 311.29 | 694.54 | 广东省 | 房地产业 |
| 3 | 龙湖集团控股有些公司 | 476.03 | 158.97 | 635 | 北京 | 房地产业 |
| 4 | 华为投资控股有限公司 | 109.45 | 431.57 | 541.02 | 广东省 | 计算机、通信和其他 电子设备制造业 |
| 5 | 新城控股集团股份有限公司 | 143.02 | 200.54 | 343.56 | 江苏省 | 房地产业 |
| 6 | 浙江吉利控股集团有限公司 | 88.86 | 236.38 | 325.24 | 浙江省 | 汽车制造业 |
| 7 | 腾讯控股有限公司 | 146.66 | 66.5 | 213.96 | 广东省 | 互联网和相关服务 |
| 8 | 美的集团股份有限公司 | 54.04 | 156.13 | 210.18 | 广东省 | 制造业 |
| 9 | 广州市时代控股集团有限公司 | 176.02 | 33.04 | 209.06 | 广东省 | 房地产业 |
| 10 | 浙江荣盛控股集团有限公司 | 85.48 | 108.81 | 194.29 | 浙江省 | 化学原料和化学制品 制造业 |
| 资料来源: Wind、笔者整理、泽平宏观 | ||||||

翻译:
Top 100 Private enterprises in China
Panorama of ranking of Private enterprises
1. Research methods
Private enterprises are the cornerstone of market economy, and the number of private enterprises in China accounts for 98%. From 2012 to 2020, the proportion of state-owned enterprises decreased from 3.36 percent to 1.17 percent, that of private enterprises increased from 96 percent to 98 percent, and that of foreign-funded enterprises decreased from 2.54 percent to 0.41 percent. In 2021, there will be 150 million market entities across the country, among which there will be more than 26 million corporate entities and more than 100 million individual industrial and commercial businesses.
From a macro perspective, private enterprises contribute more than 50 percent of tax revenue, more than 60 percent of GDP, more than 70 percent of technological innovation, more than 80 percent of urban labor employment, and more than 90 percent of the number of enterprises.
The current research on the ranking of private enterprises mainly starts from the two indicators of operating income and valuation.
The revenue ranking method obtains the data of private enterprises by means of research, and ranks them based on total revenue. Representative achievements include the annual Top 500 list released by the Federation of Industry and Commerce, the China Association of Enterprises and Fortune. This method is self-declared by enterprises from the bottom up, with high granularity, but it will miss enterprises that do not participate in the survey, and it is difficult for some enterprises to obtain cross-verification of the declaration data. 数字化转型网(www.szhzxw.cn)
The valuation ranking method ranks companies according to their market capitalization or valuation. The representative results are “Hurun China Top 500 2021” released by Hurun Research Institute. The market value of listed companies is calculated according to the closing price at the end of the year, and the valuation of non-listed companies is estimated by referring to listed companies in the same industry or according to the latest round of financing. This method is more objective, but it does not cover all non-listed companies in traditional industries.
As the main basis of the ranking of private enterprises, this paper strives to be comprehensive, objective and complete. We compare the lists of the Federation of Industry and Commerce, China Association of Enterprises, Fortune, Hurun, etc., combined with the Chinese private enterprises listed and issued bonds in China and overseas by Wind, and calculate the 2021 operating income of private enterprises. In the statistics of revenue data, priority is given to the publicly disclosed annual report data of listed companies or debt-issuing enterprises, of which 45 cases; If there is no public disclosure of annual report data, priority is given to the data disclosed by the Federation of Industry and Commerce, and there are 48 such cases; The financial statements of 7 private enterprises are inconsistent with the data disclosed by the Federation of Industry and Commerce. We guess that there are differences in tax payment and financial standards. In order to ensure the consistency of the revenue comparison of enterprises, the data disclosed by the Federation of Industry and Commerce is used uniformly in such cases.
In terms of time selection, this paper uses the operating income of 2021 as the main basis for ranking private enterprises. As of March 24, 2023, only 20 private companies have announced their revenue for fiscal year 2022. In order to ensure the comprehensive, objective and complete ranking, we choose the revenue of fiscal year 2021 as the basis for this ranking. Some private enterprises are neither listed companies nor debt issuers, and they are not yet able to obtain the 2022 fiscal year annual report from public channels. It is necessary to update the revenue data to the fiscal year 2022 after the relevant enterprises have made independent revenue declarations.
2. Portrait of top 100 private enterprises: The head is bright, the east is gathered, and the five become manufacturing
In 2021, the revenue threshold of the top 100 private enterprises is 79.14 billion yuan, and the revenue of the top five enterprises is in the range of 100-200 billion yuan. From 2012 to 2021, the share of private enterprises in the operating income of industrial enterprises above designated size will increase from 49.7 percent to 51.8 percent. The revenue thresholds of the top 30, top 50 and top 100 private enterprises are 190.39 billion yuan, 136.95 billion yuan and 79.14 billion yuan respectively. The revenue of 49 top 100 enterprises is in the range of 100-200 billion yuan, with an average revenue of 141.71 billion yuan, and hundred-billion-level private enterprises are becoming the backbone.
The entry threshold of the top ten private enterprises is about 410 billion yuan, represented by the Internet and advanced manufacturing. Among them, Jingdong, Alibaba, Tencent, ByteDance as the representative of the Internet enterprises occupy 4 seats, Jingdong’s business model is mainly self-operated, most of its sales are counted as income, with 951.59 billion yuan revenue ranked first, in 2022 revenue exceeded one trillion yuan. Chemical raw materials and chemical products manufacturing represented by Hengli Group and Rongsheng occupy 2 seats. Advanced manufacturing industries of computer, communication and electronic equipment represented by Huawei and Lenovo occupy 2 seats, real estate enterprises represented by Country Garden occupy 1 seat, and non-ferrous metal smelting and rolling processing industry represented by Shandong Weiqiao occupies 1 seat.
In terms of region, 80% of the top 100 private enterprises are concentrated in the east. By region, 82 of the top 100 private enterprises in 2021 are distributed in the eastern region, with 35, 22 and 16 in the Yangtze River Delta, Beijing-Tianjin-Hebei and Pearl River Delta. In terms of provinces, 55% of enterprises are concentrated in Guangdong, Zhejiang, Beijing and Jiangsu, and the number of top 100 private enterprises in Guangdong, Zhejiang, Beijing and Jiangsu are 16, 16, 12 and 12 respectively. From the point of view of cities, the top 100 private enterprises are mainly concentrated in Beijing, Shanghai, Guangzhou and Shenzhen and new first-tier cities. Metropolitan areas and urban agglomerations play the role of growth poles for the country’s economic and social development, and are the main platforms for promoting high-quality development and participating in international competition. The leading private enterprises are concentrated in urban agglomerations, which is in line with the general trend of China’s population and industry continuing to gather in metropolitan areas.
In terms of industry distribution, manufacturing industry accounts for more than 50% in the top 100. Industries with a higher contribution to GDP are easy to produce leading private enterprises, and traditional industries have a higher contribution to GDP. From the perspective of different industries, the cumulative contribution of industry to GDP in 2021 reached 38%, and the proportion of manufacturing enterprises in the top 100 private enterprises in 2021 reached 52%, far exceeding other industries. Wholesale and retail, information transmission, software and information technology services contributed 12.3% and 7.8% to GDP, respectively, and 17 and 9 companies in related industries entered the top 100 list. 数字化转型网(www.szhzxw.cn)
The process of capital marketization has been fruitful. In 2021, 38 of the top 100 private enterprises are listed companies, raising an average of 13.3 billion yuan. Sixteen private companies have listed sectors. Fifty-nine enterprises or their subsidiaries were the main issuers of bonds, helping to restore confidence in private enterprises through corporate bond financing. Under the reform of the comprehensive registration system, the financing threshold of high-quality enterprises represented by the private economy will be lowered, boosting the confidence of private entrepreneurs, and more and more excellent enterprises will expand the capital market in the future.
There are 20 private companies that are completely isolated from capital markets. Among the top 100 private enterprises, 20 have no listing and bond issuance records and are completely isolated from the capital market, including 9 manufacturing, wholesale and retail industries and 3.
The profitability of enterprises is differentiated. Fifty-three private enterprises disclosed their earnings for 2021. In 2021, only Tencent’s net profit margin on sales exceeded 20%, reaching 40.6%, an increase of 7.4 percentage points over the same period last year. The net interest rate of 9 private enterprises is between 10% and 20%, and there are 6 and 3 enterprises that increase/decrease their profits from last year, respectively, and the profitability of enterprises is differentiated. Among the 53 private enterprises disclosed by the data, 43 enterprises with a net interest rate of less than 10% in 2021, an increase of 4 from 2020, indicating that the economic situation at home and abroad in the past two years has affected the operation of enterprises to a certain extent, and then affected the profitability of enterprises.
3. Vertical change: industrial structure upgrading, social responsibility enhancement, transformation and high-quality development
Under the new normal of the economy, private enterprises adapt to the requirements of high-quality development. As China’s economy shifts from high-speed growth to high-quality development, private enterprises are undergoing transformation and upgrading. According to the survey of the Federation of Industry and Commerce, strengthening and expanding enterprises, policy support and guidance, upgrading product technology, and slowing down domestic economic growth are the main drivers for the transformation of private enterprises. From the perspective of transformation mode, the dimension of enterprise transformation extends from talents and enterprises to products and technologies. In 2017, the transformation of enterprises mainly through the introduction of talent, staff training and strategic adjustment, and other ways, the current enterprise hopes to achieve transformation and upgrading through technology and management innovation and improve product quality. According to the survey of the Federation of Industry and Commerce, the number of enterprises using the Internet, artificial intelligence, big data and other technologies to achieve transformation and upgrading in 2020 will account for 78.4% of the top 500. 数字化转型网(www.szhzxw.cn)
The industrial structure of the top 500 private enterprises was optimized and adjusted, with real estate falling and manufacturing rising. The top ten industries of the top 500 private enterprises are mainly traditional manufacturing, and ferrous metal smelting and rolling processing industry ranks the top, with the number of enterprises increasing by 20 during 2017-2021. The number of manufacturing companies listed in the top 500 in 2021 increased by 19 compared with 2020, up 12% year-on-year. Among them, ferrous metal smelting and rolling processing industry, electrical machinery and equipment manufacturing industry, computer communication and other electronic equipment manufacturing industry, petroleum coal and other fuel processing industry, non-ferrous metal smelting and rolling processing, chemical raw materials and chemical products manufacturing industry increased by 6, 2, 4, 3, 2 and 2 respectively. Affected by the inflection point of population growth, the liquidity crisis of housing enterprises, and the loan suspension event, the number of housing enterprises listed in the top 500 in 2021 is only 25, down 43% year-on-year. Since the implementation of the 14th Five-Year Plan, new infrastructure has gradually become an important starting point for high-quality development, a new generation of information technology, artificial intelligence, data centers have been developed, and the number of computer, communications and other electronic equipment manufacturing enterprises has increased by 4 in the past five years. Although new energy, charging piles, UHV, industrial Internet and other scientific and technological innovation fields are not among the top ten industries, they have gradually become the new engine of China’s economy.
The policy side has made efforts to reduce taxes and fees and cut interest rates to alleviate the tax, financing and cost problems of private enterprises. Raw material cost, tax burden and financing cost are the three mountains that restrict the operation of private enterprises. Since 2020, upstream raw material prices have continued to run at a high level, offline logistics consumption scenarios have been limited, and the cash flow and profits of private enterprises have been eroded. According to the survey of the Federation of Industry and Commerce, the number of enterprises with revenue exceeding 100 billion yuan in 2021 has decreased by 10 compared with 2020. Among the cost factors affecting the development of the top 500 private enterprises, the number of enterprises choosing “raw material cost”, “tax burden” and “financing cost” accounted for 65.4%, 51% and 48% of the top 500 enterprises respectively. In order to reduce the tax burden on enterprises, China has reduced taxes and fees by 1,385.5 billion yuan for individual industrial and commercial households in 2018. In order to reduce corporate financing costs, the central bank lowered LPR to guide the real loan interest rate down, and the weighted average interest rate of new corporate loans in 2022 will be 4.17%, down 0.34 percentage points year-on-year.
The social responsibility of private enterprises has been enhanced. In terms of total tax payment, from 2011 to 2021, the total tax payment of the top 500 private enterprises rose from 409.4 billion yuan to 1,366.5 billion yuan, with an annual growth rate of 13%, and the proportion of national tax rose from 4.6% to 7.9%. From 2018 to 2021, the total tax payment of the top 500 private enterprises was generally stable in the range of 1.3-1.4 trillion yuan. In terms of targeted poverty alleviation, the number of enterprises participating in targeted poverty alleviation in the top 500 rose from 227 in 2017 to 348 in 2021, and the proportion of the top 500 private enterprises rose from 45.4% to 69.6%. In terms of pollution prevention and control, the proportion of enterprises in the top 500 that have participated in pollution prevention and control has increased from 68.2% in 2017 to 85.2% in 2021.
International management ability to improve. In 2021, the total exports of the top 500 private enterprises reached 245.4 billion US dollars, an increase of 85.5%. The contribution rate of the top 500 private enterprises to the country’s exports rose from 5.5% in 2017 to 7.3% in 2021. In 2021, the overseas investment projects of top 500 private enterprises reached 2,701, up 79.7% from 2017. 54% of the top 500 companies in 2021 will make foreign direct investment, and 39% will “go global” by exporting products and services.
Top 10 Job seekers
From 2012 to 2021, urban employment will increase from 372.87 million to 467.73 million, an increase of 25.4 percent. Among them, the number of people employed in urban private enterprises and individuals increased from 75.57 million and 56.43 million in 2012 to 145.67 million and 116.92 million in 2019, an increase of 92.8% and 107.2%, respectively.
Employment is an important guarantee for economic stability and a “ballast” for people to live and work in peace and contentment. According to the State Administration of Market Regulation, private enterprises absorb more than 80% of urban labor employment, and are the main carrier of entrepreneurship and employment. The data of the top 10 employment list comes from Wind, covering listed companies and debt-issuing enterprises with data, while non-public data and enterprises with large data deviations under different statistical calibers are not included.
The threshold for the top 10 private enterprises to create jobs in 2021 is 115,000. Jd Group took the first place in terms of job creation, with its total number of employees exceeding 300,000 to 385,000. Byd, Alibaba Group and Lishun Precision ranked second, third and fourth, with a total employment of more than 200,000 people. 数字化转型网(www.szhzxw.cn)
In terms of industry distribution, 3 companies are computer, communication and other electronic equipment manufacturing, and 2 companies are Internet and related services and automobile manufacturing.
Top 10 Innovative Enterprises
From the perspective of research and development innovation, from 2012 to 2021, the number of patents applied by industrial enterprises above designated size increased from 489,945 to 1,403,611, an increase of about three times. Among them, the number of patents filed by private enterprises increased from 29.4% in 2012 to 51.4% in 2021. The sales revenue of new products of industrial enterprises above designated size increased from 1105.298 billion yuan in 2012 to 295.6669 billion yuan in 2021, and the proportion of private enterprises increased from 14.97% in 2012 to 37.92% in 2021.
In order to measure the innovation ability of private enterprises, the weighted results of R&D expenses (100 million yuan) and the proportion of R&D expenses to revenue (%) are defined. The data of the top 10 employment list comes from Wind, covering listed companies and debt-issuing enterprises with data, while non-public data and enterprises with large data deviations under different statistical calibers are not included.
The top five innovative private enterprises in 2021 are Huawei, Baidu, Kuaishou, NetEase and Tencent. In terms of R&D expenses, the R&D expenses of Huawei, Alibaba and Tencent exceeded 50 billion yuan, reaching 142.57 billion yuan, 57.24 billion yuan and 51.88 billion yuan respectively. In terms of R&D investment intensity, the top five private enterprises are Huawei, Baidu, Kuaishou, NetEase and Ant Group, with R&D expenses accounting for more than 10% of revenue.
Top 10 private enterprise tax payers
The data of the top 10 tax payment list of private enterprises comes from Wind- balance sheet – Tax payable (tax payable) and various taxes paid in the cash flow statement, and comprehensively considers the taxes paid and unpaid by enterprises, so as to measure the tax payment strength of enterprises in a more comprehensive way. 数字化转型网(www.szhzxw.cn)
The statistical caliber is different from the “tax amount” in the list of the Federation of Industry and Commerce, so the ranking and value of enterprises in the two lists are different. This list covers listed companies and debt-issuing enterprises with data, and does not include enterprises with non-public data and large data deviations under different statistical calibers.
From the perspective of tax industry, the real estate industry represented by Sunac, Country Garden, Longfor Group, New City Holdings and Times Holdings occupies 5 seats, and the computer, communications and other electronic equipment manufacturing industry represented by Huawei and Lenovo occupies 2 seats. By province, five of the top 10 are from Guangdong.
本文由数字化转型网(www.szhzxw.cn)转载而成,来源于泽平宏观,作者任泽平;编辑/翻译:数字化转型网宁檬树。
免责声明: 本网站(http://www.szhzxw.cn/)内容主要来自原创、合作媒体供稿和第三方投稿,凡在本网站出现的信息,均仅供参考。本网站将尽力确保所提供信息的准确性及可靠性,但不保证有关资料的准确性及可靠性,读者在使用前请进一步核实,并对任何自主决定的行为负责。本网站对有关资料所引致的错误、不确或遗漏,概不负任何法律责任。
本网站刊载的所有内容(包括但不仅限文字、图片、LOGO、音频、视频、软件、程序等) 版权归原作者所有。任何单位或个人认为本网站中的内容可能涉嫌侵犯其知识产权或存在不实内容时,请及时通知本站,予以删除。