
随着大数据、云计算、人工智能等技术加速创新,数据已成为重要生产要素。IDC在2020年发布的“2020年的数字宇宙”指出,全球数据总量已超过40ZB,近两年这个数字持续增长,其中超过三分之一的数据包含有价值的信息。2022年,我国大数据市场产值已超过数万亿元,面对海量数据,如何挖掘数据价值,将看似毫无关联的数据串联起来,利用数据分析手段进行精准营销成为各行各业关注的焦点问题,而用户行为数据分析作为追踪用户行为、完善客户画像、辅助精准营销、构建实时推荐等闭环场景的关键要素,已成为辅助业务分析决策、助力数字化转型的重中之重。数字化转型网www.szhzxw.cn
一、追本溯源:为什么要做用户行为数据分析
什么是用户行为?用户行为可以用“5W2H”进行概括:Who(谁)、What(做了什么行为)、When(什么时间)、Where(在哪里)、Why(目的是什么)、How(通过何种方式)、How long(用了多长时间),即时间、地点、人物、交互以及交互的内容,而用户行为数据分析则是通过对这类数据进行统计、聚合和分析,从中发现用户使用产品的规律,进一步将这些规律与业务营销策划、产品更新迭代和运营策略相结合,发现营销、运营以及产品本身存在的问题,从而提出解决方案,优化用户体验,实现精细化、精准化的运营与营销。数字化转型网www.szhzxw.cn
随着互联网时代的演进,流量增长红利逐渐消退,各行各业的竞争愈发激烈,金融行业也不例外,获客成本飙升。客户经理有时甚至需要上百次面对面营销,才能获得一个新增客户。在如此高成本、高竞争的环境下,农业银行急需利用用户行为数据分析,做好精细化运营,有效利用客户基数大的优势,将海量客户资源转化为业务价值,从而降低运营成本,提升营销效果,进一步提高企业竞争力。
二、知己知彼:用户行为数据分析如何做
用户行为分析如此重要,业内能够做好此类数据分析的企业却是凤毛麟角,能够自研建设分析平台的更是少之又少,这是为什么呢?笔者认为主要原因是传统分析数据精度不够、采集信息不全面、分析模型不完善,导致分析结果粗放,实际应用价值低,难以起到辅助营销决策的作用。
根据前期调研,商业银行同类数据分析系统主要以采购为主,工商银行以采购加自研的形式实现了用于运营分析(日活、月活、新增客户数)、转化分析(开户转化率、注册转化率等)、标签体系(用户标签、自动化运营)等功能,整体数据分析能力较为全面。招商银行主要用于该行掌上生活平台月活跃(MAU)、用户来源及组成等内容分析,侧重总体变化趋势分析。中信银行则更侧重体验监控,对其手机银行的页面访问成功率、启动时长、崩溃率等指标进行了分析展示。综上分析可以发现,同业在PV、UV统计、体验分析、用户活跃度方面已有优秀实践,取得了不错的效果。在借鉴同业的基础上,农业银行用户行为数据采集分析平台在模型丰富度、实时分析灵活性以及定制化营销场景支撑度方面,根据自身情况做出了优化提升。数字化转型网www.szhzxw.cn
想要做好用户行为数据分析,首先要有精准且高效的数据采集手段。数据采集的主要手段分为手动埋点(代码埋点)和自动埋点(全埋点)。手动埋点的优势在于采集数据精确且信息定制化,缺点则在于需要耗费大量人力进行代码改造,过程繁琐,尤其在移动应用领域,每次埋点后都需要发布至应用商店才能生效,苹果商店的审核周期更是硬伤,这使得手动埋点数据获取时效性大打折扣,往往无法满足业务推广时效性的需要;自动埋点则是通过标准化格式将用户常见行为分为不同事件进行采集,其优势在于无需额外埋点,一次嵌入即可满足采集要求,极大程度上增强了数据采集的及时性和全面性,而劣势则在于不支持采集信息定制化,可能无法满足个性化营销场景分析的数据需要。
有了精确、详细的用户行为数据,还需要结合业务场景提出科学有效的分析模型,才能更有效地支持分析结果。农业银行上一代用户行为分析系统主要局限于浏览行为,即对页面访问、点击量(PV)和独立客户数(UV)等数据进行统计,并未针对用户交互行为进行研究,因此其分析结果价值相对有限,无法对实际运营决策、营销推广场景起到辅助作用。结合自身业务场景,建立诸如漏斗分析、路径分析、留存分析等用户转化分析模型,从获取用户、激活用户、用户留存、收入获取四方面入手,建立用户行为数据分析模型体系,才能起到真正辅助业务决策的分析作用。
三、综合赋能:平台提供什么服务
农业银行新一代用户行为数据采集分析平台随掌银6.8版本首次亮相,标志着农业银行自研实现的用户行为数据采集分析平台顺利上线。
1、全渠道埋点采集,行为数据无盲点数字化转型网www.szhzxw.cn
用户行为数据采集分析平台采集SDK以准确、灵活、安全为目标,使用全埋点和代码埋点相结合的无侵入方案,支持Android、iOS、Web、mPaas小程序、微信小程序等全渠道数据采集,以较小的埋点代价,在用户同意且法律允许的范围内,合规可控的收集用户行为数据,同时考虑采集精确性和埋点接入便捷程度,保证了多平台、全渠道采集全面性和接入便利性。采集SDK架构如图1所示。
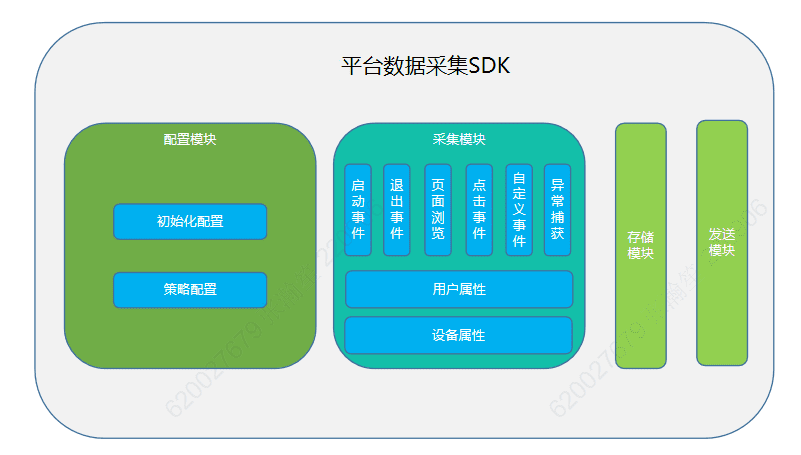
SDK由配置模块、采集模块、存储模块和发送模块组成,支持通过用户行为数据采集分析平台管理端配置不同采集策略,实时控制SDK的采集字段和范围以满足用户隐私策略需要,保障数据采集灵活可控、合规安全,有效解决采集数据不可控、涉及用户隐私的痛点问题。采集到的用户行为数据待满足发送条件后批量压缩发送,在节省用户数据流量、提高发送性能的同时,最大限度地保证采集数据的准确性和实时性,从而解决采集精度低、数据时效性差,进而影响分析人员实际使用的问题,由“能用”进化为“好用”。
截至目前,用户行为数据采集分析平台已与个人掌银、企业掌银、营销Pad等5个农业银行主要移动应用完成对接,H5渠道覆盖个人掌银中57个总行应用和37家一级分行100余个H5应用接入,单日采集掌银数据超8亿条。数字化转型网www.szhzxw.cn
2、数据实时全采集,流批一体再分析
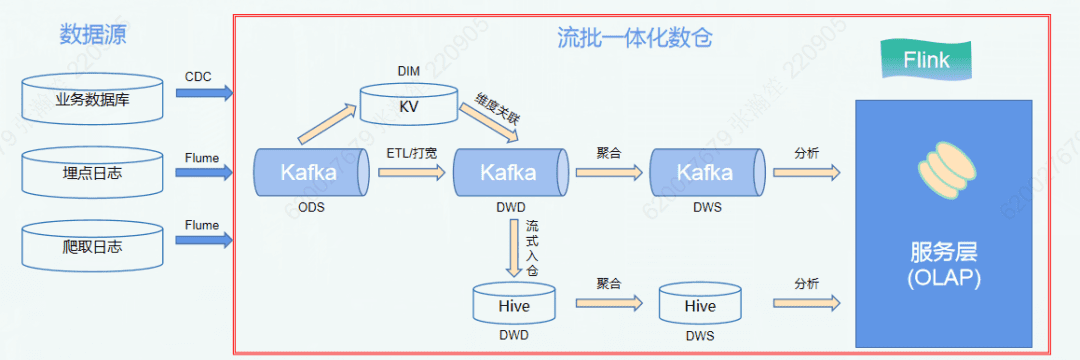
数据采集集群和数仓模块灵活应用Kafka、Flink、Hive、HDFS等大数据技术组件,采用流批一体化设计,满足“实时、精准地感知和响应”的业内先进设计理念。后端采集服务将获取到的数据进行解析处理,完成非法数据清除并通过事件类型进行区分,写入Kafka以供数仓模块进行消费。数仓模块使用Flink进行数据传输,在过程中完成数据清洗、字段划分、打散并形成宽表,同步将数据推送至大数据平台,为其他应用系统提供数据支撑。离线分析数据通过Flume写入HDFS,为后续批量数据处理提供数据源,实时分析数据则直接写入Clickhouse分析型数据库集群,由平台管理端向总分行业务人员提供海量数据实时秒级查询服务。数仓模块数据处理流程如图2所示。
3、全面大数据分析,分析模型再拓展
用户行为数据采集分析平台以农业银行掌银渠道为出发点,多种分析模型并行形成数据闭环,将全渠道营销场景支持作为目标,依托新型联机分析(OLAP)列式数据库管理系统Clickhouse,实现数据实时高速写入、高性能向量计算,可根据业务需求,提供不同分析模型实时数据分析展示,为高基数、多维度的海量数据复杂查询分析场景提供了强有力的技术支撑。现阶段,用户行为数据采集分析平台已完成指标大盘、地域分析、用户转化漏斗分析、访问路径分析、留存分析、用户体验分析等分析模型建设。
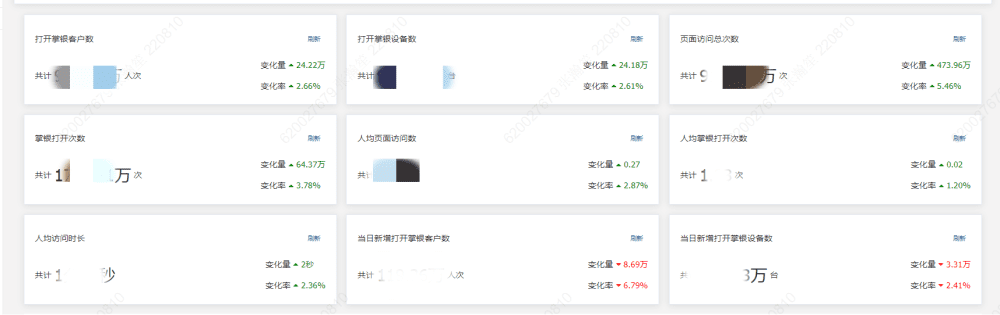
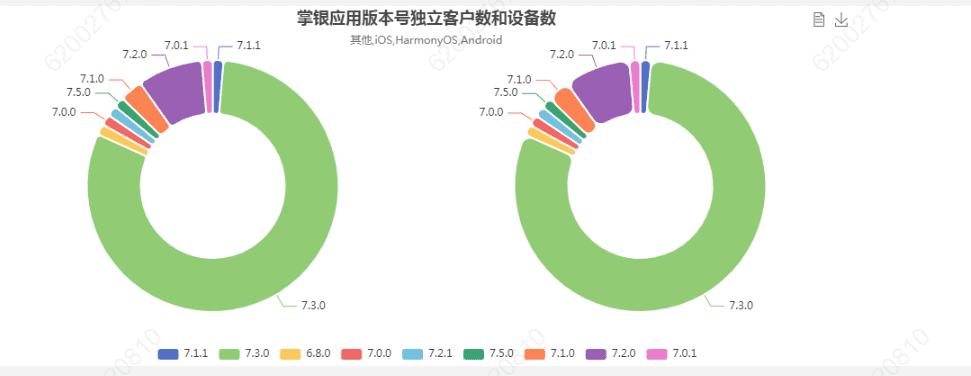
(1)指标大盘
指标大盘(如图3所示)提供宏观数据变化展示,在囊括传统PV、UV、新增客户数、访问时长等数据统计的同时,配合饼图直观体现版本占比(如图4所示);结合地域分析可以准确识别新版本推广过程中各省新增用户数量的地域差异,让业务人员可由此加大特定地区新版本推广力度,通过新客礼等营销活动,大幅提升该应用曝光率,有效提升该地区新版本新用户使用数。掌银典型营销活动“新客三重礼”通过指标大盘及地域分析日均点击人数指标,结合用户行为分析页面浏览和点击操作数据,整合优化活动入口,在8月上旬的活动中,日均点击人数较上月提升超六成,有效提升了营销活动触达率。
(2)漏斗分析
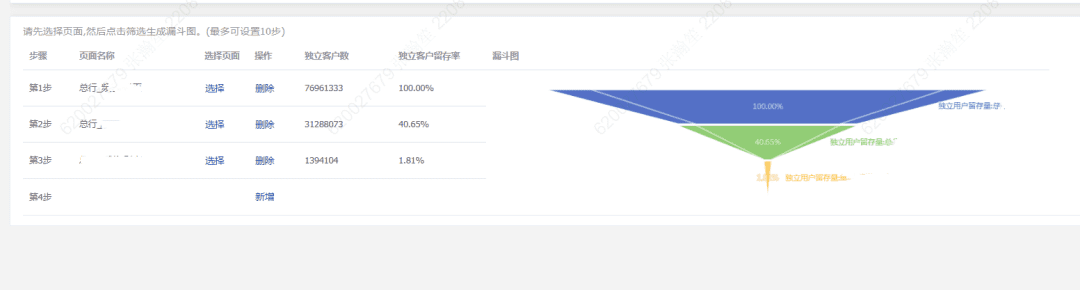
转化率分析主要通过统计用户在操作流程中的逐步流失情况,形成一个类似漏斗的图形(如图5所示)。用户转化漏斗分析模型支持渠道、操作系统、版本号等多维度筛选条件,可帮助业务掌握不同渠道、不同版本、不同操作系统的转化差异,用于优化渠道、优化新版本以及对比用户使用习惯。在实际使用过程中,往往需要业务人员通过对产品的了解和运营经验去构建漏斗,但这个漏斗是否具有代表性、其访问顺序是否正确都是未知的,这时就需要访问路径分析模型的辅助。数字化转型网www.szhzxw.cn
(3)访问路径分析
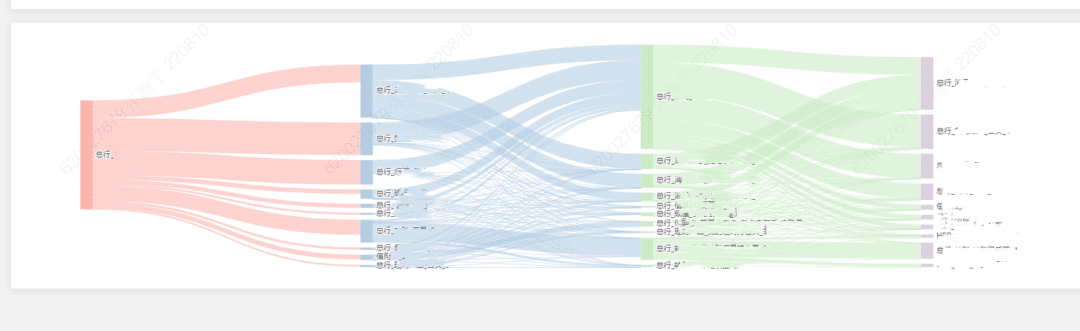
访问路径分析模型(如图6所示)可以获知用户浏览习惯,以桑基图的形式直观展示用户到达网站或应用首页等页面后,TOP页面访问路径及其转化率、流失率,使得业务人员能够快速、直观的认识产品主流访问路径转化情况。数字货币新客营销转化率低一直是数币新客引流过程中的痛点问题,依托路径分析确认数字货币新客注册页面流转情况,再从新客注册、身份信息绑定到最后权益领取完成新客引流,进行逐级逐步用户转化率漏斗分析,确定用户高流失率环节,针对性地进行流程优化。截止7月底,数币新客营销活动权益使用用户超过八成,单环节转化率较优化前提升近三分之一。
(4)用户流转地图
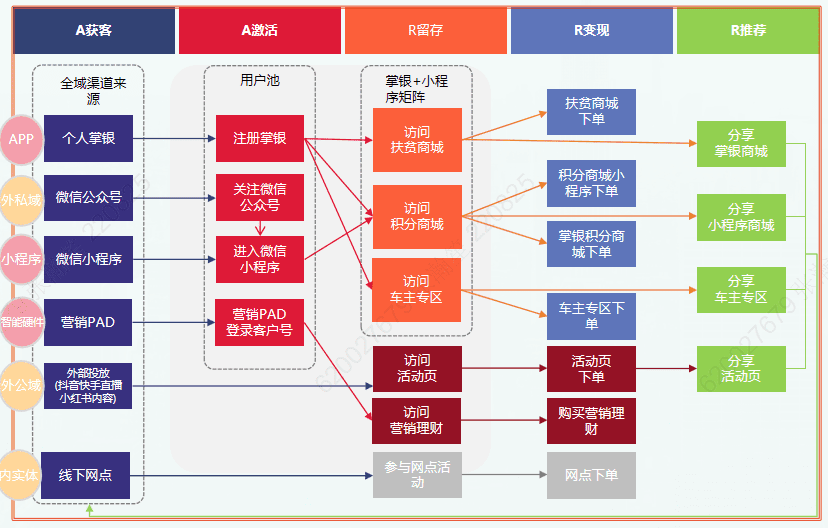
用户流转地图(如图7所示)基于海盗(AARRR)模型,从用户营销全生命周期分为获客、激活、留存、变现、推荐五个渐进维度将业务进行拆解,实现数据分析与营销场景的有机结合,定制化提供精准分析模型,真正做到将数据分析应用到实际营销活动中,通过各页面转化率、点击量的数据变化,直观体现用户实际购买、完成交易情况,帮助业务人员了解用户在哪一个页面、哪一步操作放弃交易,从而优化购买逻辑,改变营销策略。
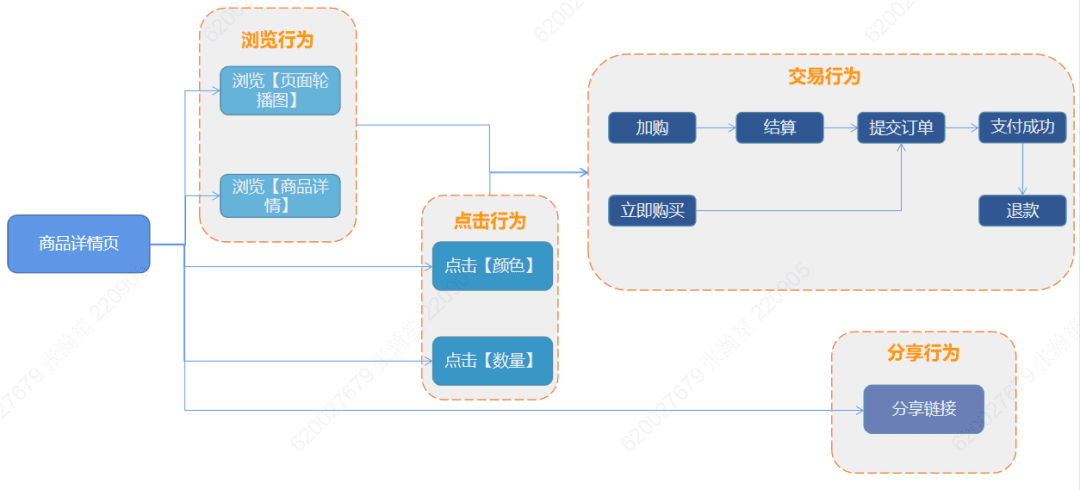
用户行为数据采集分析平台定制营销主题集市,为业务营销活动提供定制化用户流转地图实时分析模型(如图8所示),通过可视化关键节点流转情况,基于页面打开率、立即购买率、交易成功率、活动分析率等度量指标,建立以业务为导向、用户全生命周期、可逐层拆解的基于全域化、平台化、精细化实现营销场景内外循环和数据指标体系,以提高行内各渠道MAU作为战略目标,为业务方提供高可信价值的数据参考以及有针对性的优化引流活动方案。数字化转型网www.szhzxw.cn
平台还提供7日、15日、30日留存分析,帮助各级管理员分析用户特定始末行为的留存情况,判断客户的使用习惯及该行为的用户黏性,辅助业务人员了解产品的核心功能,从而增强产品服务体验。用户体验分析实时监控各应用渠道生产实际运行情况,及时捕捉客户使用过程中发生的各类异常信息,进行聚合和详细分析,帮助应用及时定位异常原因,从而快速解决异常现象,提升客户体验。
四、砥砺前行:行为数据分析应用展望
长风破浪会有时,直挂云帆济沧海。未来,用户行为数据采集分析平台还将提供包括地域热力图、趋势分析、用户分群等复杂分析模型在内的多形式、多维度用户数据分析功能,在保证百亿级数据秒级查询的基础上,从解决业务痛点出发,从多角度剖析客户行为,为业务营销决策助力;使用实时大屏和传统图表展示相结合,以助力业务决策为根本,针对不同营销场景,提供定制化营销主题分析,真正将数据分析与业务决策结合起来,努力将用户行为数据采集分析平台建设成“有用”“好用”“愿意用”的数据分析平台,为业务人员提供最实时、最精准、最直观的用户数据分析服务,全面提升农业银行用户行为数据分析决策能力,促进数字化转型,实现“打造客户体验一流的智慧银行”的目标。数

字化转型网www.szhzxw.cn
翻译:
As innovation in big data, cloud computing, artificial intelligence and other technologies accelerates, data has become an important factor of production. IDC’s “Digital Universe 2020” released in 2020 pointed out that the total amount of data in the world has exceeded 40 ZBS, and the number has continued to increase in the past two years, with more than one-third of data packets containing valuable information. In 2022, the output value of China’s big data market has exceeded trillions of yuan.
Faced with massive data, how to mine the value of data, connect seemingly unrelated data in series, and use data analysis methods for precision marketing has become the focus of attention of all walks of life. As a key element of closed-loop scenarios such as tracking user behavior, improving customer portrait, assisting precision marketing, and constructing real-time recommendation, user behavior data analysis has become a top priority in assisting business analysis and decision-making and facilitating digital transformation.数字化转型网www.szhzxw.cn
Trace back to the source: Why do user behavior data analysis
What is user behavior? User behavior can be summarized as “5W2H” : Who, What, When, Where, Why, How, and How long, i.e., time, place, people, interaction, and the content of the interaction, The analysis of user behavior data is to find out the rules of users’ use of products through statistics, aggregation and analysis of such data, and further combine these rules with business marketing planning, product updating and iteration and operation strategies to find the existing problems in marketing, operation and products, so as to propose solutions and optimize user experience. Achieve refined and precise operation and marketing.
With the evolution of the Internet era, the dividend of traffic growth gradually fades, and the competition in all walks of life becomes increasingly fierce. The financial industry is no exception, and the cost of acquiring customers soars. Account managers sometimes need hundreds of face-to-face sales to get a new client. In such a high-cost and highly competitive environment, Agricultural Bank of China urgently needs to make use of user behavior data analysis, do a fine operation, effectively take advantage of its large customer base, and transform massive customer resources into business value, so as to reduce operating costs, improve marketing effects and further improve corporate competitiveness.
Knowing Oneself and Enemy: How to do user behavior data analysis数字化转型网www.szhzxw.cn
User behavior analysis is so important that few companies in the industry can do this kind of data analysis, and even fewer can build their own analysis platform. Why? The author believes that the main reason is that the accuracy of traditional analysis data is not enough, the collection of information is not comprehensive, the analysis model is not perfect, resulting in extensive analysis results, low practical application value, difficult to play the role of auxiliary marketing decision.
According to the preliminary research, similar data analysis systems of commercial banks mainly focus on procurement. Icbc has realized the functions of operation analysis (daily activity, monthly activity, number of new customers), transformation analysis (account opening conversion rate, registration conversion rate, etc.), label system (user label, automatic operation) and other functions in the form of procurement and self-research. The overall data analysis capability is relatively comprehensive. China Merchants Bank is mainly used for the analysis of monthly active (MAU), user sources and composition of the handheld living platform, focusing on the overall change trend analysis.
China Citic Bank, on the other hand, focuses more on experience monitoring, analyzing and displaying the page access success rate, startup time, crash rate and other indicators of its mobile bank. In summary, it can be found that the industry has excellent practices in PV, UV statistics, experience analysis and user activity, and has achieved good results. On the basis of learning from other industries, the user behavior data acquisition and analysis platform of Agricultural Bank of China has been optimized and improved according to its own situation in terms of model richness, real-time analysis flexibility and customized marketing scenario support.
In order to do a good job in user behavior data analysis, we must first have accurate and efficient data acquisition means.
The main means of data acquisition can be divided into manual burying point. (Code burying point) and automatic burying point (full burying point). The advantages of manual embedding lie in accurate data collection and customized information, while the disadvantages lie in the tedious process of code transformation that requires a large amount of manpower, especially in the field of mobile applications. After each embedding, it needs to be released to the app store to take effect. The review cycle of Apple Store is even more severe, which greatly reduces the timeliness of manual embedding data acquisition.
Often cannot meet the needs of timeliness of business promotion. Automatic embedding is to collect common user behaviors into different events in a standardized format. Its advantage lies in that it does not require additional embedding and can meet the collection requirements once embedded. Which greatly enhances the timeliness and comprehensiveness of data collection. However, its disadvantage lies in that it does not support the customization of information collection. Which may not meet the data needs of personalized marketing scenario analysis.
With accurate and detailed user behavior data
With accurate and detailed user behavior data, it is necessary to put forward a scientific and effective analysis model combined with business scenarios to support the analysis results more effectively. The previous generation of user behavior analysis system of Agricultural Bank of China was mainly limited to browsing behavior, that is, to make statistics on page visits, clicks (PV), independent customers (UV) and other data, but did not study user interaction behavior.
Therefore, its analysis results were relatively limited in value and could not play an auxiliary role in actual operation decisions and marketing promotion scenarios. In combination with its own business scenarios. It establishes user transformation analysis models such as funnel analysis, path analysis and retention analysis. And establishes user behavior data analysis model system from the four aspects of user acquisition, user activation, user retention and income acquisition. So as to play a real role in supporting business decision analysis.
Integrated Enabling: What services does the platform provide
Agricultural Bank of China’s new generation user behavior data collection and analysis platform, version 6.8, debuted, marking the smooth launch of the user behavior data collection and analysis platform developed by Agricultural Bank of China.
All-channel buried spot collection, no blind spot of behavioral data
The acquisition SDK of the user behavior data acquisition and analysis platform aims at accuracy, flexibility and security. It uses a non-invasive scheme combining full buried points and code buried points. And supports the all-channel data acquisition of Android, iOS, Web, mPaas mini programs, wechat mini programs and so on. At a small cost of embedding points, within the scope of user consent and legal permission. The user behavior data can be collected in a compliant and controllable manner. And the accuracy of collection and the convenience of embedding point access are considered at the same time. Ensuring the comprehensiveness of multi-platform, all-channel collection and access convenience. The acquisition SDK architecture is shown in Figure 1.数字化转型网www.szhzxw.cn
Figure 1 Capture SDK architecture
The SDK consists of configuration module, collection module, storage module and sending module.
It supports the configuration of different collection strategies through the management side of the user behavior data collection and analysis platform to control the collection fields and ranges of the SDK in real time to meet the needs of user privacy policies and ensure the flexibility, controllability, compliance and security of data collection. Effectively solve the pain points of uncontrollable data collection and user privacy. The collected user behavior data shall be compressed and sent in batches after meeting the sending conditions. Which not only saves the user data flow and improves the sending performance. But also ensures the accuracy and real-time performance of the collected data to the maximum extent. So as to solve the problems of low collection accuracy and poor data timeliness. Which further affect the actual use of analysts, and evolves from “usable” to “usable”.
Up to now, the user behavior data collection and analysis platform has connected with five major mobile apps of Agricultural Bank of China. Including Personal Palm Banking, Enterprise Palm Banking and Marketing Pad. The H5 channel has covered 57 head office apps of Personal Palm Banking and more than 100 H5 apps of 37 first-level branches. Collecting over 800 million pieces of palm banking data in a single day.
Real-time data collection, reanalysis of flow and batch
The data acquisition cluster and data warehouse module flexibly apply big data technology components such as Kafka, Flink, Hive and HDFS, and adopt the flow-batch integrated design to meet the advanced design concept of “real-time, accurate perception and response” in the industry. The back-end acquisition service will obtain the data for analytic processing. Complete illegal data clearing and differentiated by event type, write to Kafka for data warehouse module for consumption. Data warehouse module uses Flink for data transmission.
In the process, data cleaning, field division, scattering and wide table are completed. And data is synchronously pushed to the big data platform to provide data support for other application systems. The offline analysis data is written to HDFS through Flume to provide data sources for subsequent batch data processing. The real-time analysis data is directly written to the Clickhouse analytical database cluster. The platform management side provides real-time second-level query service for massive data to the service personnel in the head office. The data processing flow of warehouse module is shown in Figure 2.
Figure 2 Data processing flow of data warehouse module
Comprehensive big data analysis and further expansion of the analysis model
The user behavior data acquisition and analysis platform starts from the AgBank’s master banking channel. Forms a data closed-loop with multiple analysis models in parallel, takes the support of omni-channel marketing scenarios as the goal, and relies on the new OLAP column database management system Clickhouse to realize real-time high-speed data writing and high-performance vector calculation. It provides real-time data analysis and display of different analysis models, and provides strong technical support for complex query and analysis scenarios of massive data with high cardinality and multi-dimension. At this stage, the user behavior data collection and analysis platform has completed the construction of analysis models such as index market, regional analysis, user conversion funnel analysis, access path analysis, retention analysis, and user experience analysis.
(1) index market
Index market (as shown in Figure 3) provides macro data change display. Including traditional PV, UV, the number of new customers, visit time and other data statistics. While using pie chart to directly reflect the version proportion (as shown in Figure 4); Combined with regional analysis. It can accurately identify the regional differences in the number of new users in each province during the promotion of the new version. So that business personnel can increase the promotion of the new version in a specific region. Greatly improve the exposure rate of the application through marketing activities such as new gift. And effectively increase the number of new users of the new version in the region.
The typical marketing campaign “New Customer Triple Gift” of Palm Silver integrated and optimized the entry of the activity by analyzing the average daily click number index of the index market and region, combined with the page browsing and click operation data of user behavior analysis. In the activity in early August, the average daily click number increased by over 60% compared with last month. Which effectively improved the reach rate of the marketing activity.数字化转型网www.szhzxw.cn
Figure 3 Index market
Figure 4 Version proportion
(2) Funnel analysis
Conversion rate analysis mainly calculates the gradual loss of users in the operation process to form a funnel like graph (as shown in Figure 5). The user conversion funnel analysis model supports multi-dimensional screening conditions such as channel, operating system and version number. And can help businesses to grasp the conversion differences of different channels, versions and operating systems. So as to optimize channels, optimize new versions and compare user usage habits. In the actual use process, it is often necessary for business personnel to build funnel based on their understanding of the product and operational experience. However, whether the funnel is representative or not and whether its access order is correct is unknown. In this case, the assistance of access path analysis model is needed.
Figure 5 Funnel analysis
(3) Access path analysis
The access path analysis model (as shown in Figure 6) can learn users’ browsing habits and visually display the TOP page access path, its conversion rate and loss rate after users arrive at the homepage of websites or applications in the form of mulberry chart. So that business personnel can quickly and intuitively understand the transformation of mainstream access paths of products. The low conversion rate of digital currency new customer marketing has always been a pain point in the process of attracting new customers of digital currency.
It relies on path analysis to confirm the flow of digital currency new customer registration page. And then completes the diversion of new customers by new customer registration and identity information binding to the final benefit collection. It carries out step by step user conversion funnel analysis to determine the link of high user churn rate and optimize the process accordingly. By the end of July, more than 80% of the new customers’ equity users had used the marketing activities. And the conversion rate of single link increased by nearly one-third compared with before optimization.
Figure 6 Access path analysis
(4) User flow map
The user flow map (as shown in Figure 7) is based on the Pirate (AARRR) model. The whole user marketing life cycle is divided into five progressive dimensions: customer acquisition, activation, retention, realization, and recommendation. The business is disintegrated to realize the organic combination of data analysis and marketing scenarios. And the customized accurate analysis model is provided to truly apply data analysis to actual marketing activities. Through the data changes of conversion rate and click amount of each page. It intuitively reflects the actual purchase and transaction completion of users. And helps business personnel to know which page and which step users give up transactions. So as to optimize the purchase logic and change the marketing strategy.
Figure 7 User flow map model
The user behavior data acquisition and analysis platform customizes the marketing theme market and provides customized real-time analysis model of user flow map for business marketing activities (as shown in Figure 8). By visualizing the flow of key nodes, based on metrics such as page opening rate, immediate purchase rate, transaction success rate and activity analysis rate, Establish a business-oriented, user lifecycle, layer by layer disintegration-based, platform-based and refined marketing scene internal and external circulation and data index system, to improve the MAU of each channel as a strategic goal, to provide business parties with high credible value of data reference and targeted optimization of drainage activities.
Figure 8 User flow map analysis logic
The platform also provides 7-day, 15-day and 30-day retention analysis to help administrators at all levels analyze the retention of specific user behaviors, judge customer usage habits and user stickiness of such behaviors. Assist business personnel to understand the core functions of products, and thus enhance product service experience. User experience analysis Monitors the actual running status of application channels in real time. Captures all kinds of abnormal information in the process of using customers in a timely manner, aggregates and analyzes the information in detail. And helps applications locate anomalies in a timely manner to quickly resolve anomalies and improve customer experience.
Push Forward: Prospects of behavioral data analysis Applications
Long wind and waves will sometimes hang the cloud sail to the sea. In the future, the user behavior data acquisition and analysis platform will also provide multi-form and multi-dimensional user data analysis functions. Including regional thermal map, trend analysis, user groupings and other complex analysis models. On the basis of ensuring the second-level query of tens of billions of data. Customer behavior is analyzed from multiple perspectives to help business marketing decisions. The real-time large screen and traditional chart display are combined to help business decision-making.
Customized marketing theme analysis is provided for different marketing scenarios. Data analysis is truly combined with business decision-making. And the user behavior data collection and analysis platform is built into a “useful”, “easy to use” and “willing to use” data analysis platform. Provide the most real-time, accurate and intuitive user data analysis services for business personnel, comprehensively improve the analysis and decision-making ability of user behavior data of Agricultural Bank, promote digital transformation. And realize the goal of “building a smart bank with first-class customer experience”.
本文由数字化转型网(www.szhzxw.cn)转载而成,来源:我们的开心;编辑/翻译:数字化转型网宁檬树。
免责声明: 本网站(https://www.szhzxw.cn/)内容主要来自原创、合作媒体供稿和第三方投稿,凡在本网站出现的信息,均仅供参考。本网站将尽力确保所提供信息的准确性及可靠性,但不保证有关资料的准确性及可靠性,读者在使用前请进一步核实,并对任何自主决定的行为负责。本网站对有关资料所引致的错误、不确或遗漏,概不负任何法律责任。
本网站刊载的所有内容(包括但不仅限文字、图片、LOGO、音频、视频、软件、程序等) 版权归原作者所有。任何单位或个人认为本网站中的内容可能涉嫌侵犯其知识产权或存在不实内容时,请及时通知本站,予以删除。